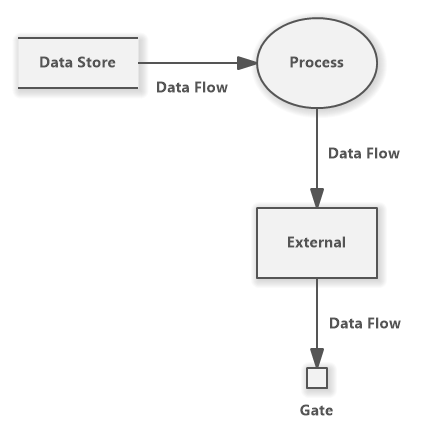
A data flow diagram is just as it sounds - a graphical representation of how data traverses through a system.
Components of a DFD
System processes
 Illustrated as a circle/oval, a system process receives and manipulates data. Essentially, the processes are the ‘functions’ inside of your system.
External entities
 Illustrated as a box, an external entity refers to anything outside your system that interacts with it. For example, user input would be an external entity, or displaying it to an output would be an external entity.
Data sources would be your inputs. These provide data to your system. This means that data flows away from these entities.
Data sinks would be your outputs. After your system’s done with manipulating data, your data will end up in these data sinks. This means that data flows into these entities.
Data stores
 Illustrated by 2 parallel lines, data stores refer to (obviously) storage systems. This could be your system’s database or some other data repository, or even something like a txt file.
Data flows
 Illustrated by the arrows, this refers to the direction of where the data is flowing.